The maintenance reference desk

Maintenance statistics.
The numbers, with context.

What does downtime cost? How much maintenance is reactive? How fast is the workforce growing? A source-checked reference for reporting on the work that keeps equipment running.

Compiled by RunTight Reviewed

A review date is not a data year. The NIST cost estimates below describe 2016, in 2016 dollars. BLS workforce observations describe 2025, with projections through 2035. This is a compilation of external research, not a RunTight customer survey.

01 / The economic impact

Maintenance costs & downtime

Historical national estimates with the original dollar year preserved. These figures describe the industries in the study, not the cost of a typical breakdown.

2016 · 2016 USD

$57.3bn

Direct maintenance spending

NIST estimated $57.3 billion in direct machinery maintenance costs for U.S. discrete manufacturing in 2016.

Scope
U.S. discrete manufacturing; NAICS 321–339, excluding 324 and 325
When citing
90% confidence interval: $42.4–$72.2 billion. This is spending, not preventable loss. A 2021 analysis of the same survey gives different estimates; see the method comparison below.
NIST AMS 100-34

Table 8.1, printed p. 39 (PDF p. 45)

Compare the 2020 and 2021 methods →Permanent link
Cite this statistic: Direct maintenance spending

2016 · 2016 USD

$119.1bn

Preventable maintenance losses

NIST estimated $119.1 billion in losses from preventable maintenance issues in U.S. discrete manufacturing in 2016.

Scope
U.S. discrete manufacturing; NAICS 321–339, excluding 324 and 325
When citing
90% confidence interval: $43.9–$197.3 billion. Includes downtime, defects, and lost sales; not downtime alone.
NIST AMS 100-34

Table 8.1, printed p. 39 (PDF p. 45)

Permanent link
Cite this statistic: Preventable maintenance losses

2016 · 2016 USD

$18.1bn

Unplanned downtime losses

NIST’s 2016 estimate for unplanned downtime losses in U.S. discrete manufacturing was $18.1 billion.

Scope
U.S. discrete manufacturing; NAICS 321–339, excluding 324 and 325
When citing
90% confidence interval: $10.4–$27.8 billion. Already included in the $119.1 billion total; do not add it again.
NIST AMS 100-34

Table 8.1, printed p. 39 (PDF p. 45)

Permanent link
Cite this statistic: Unplanned downtime losses

A note for your reporting

Why do NIST maintenance cost estimates differ?

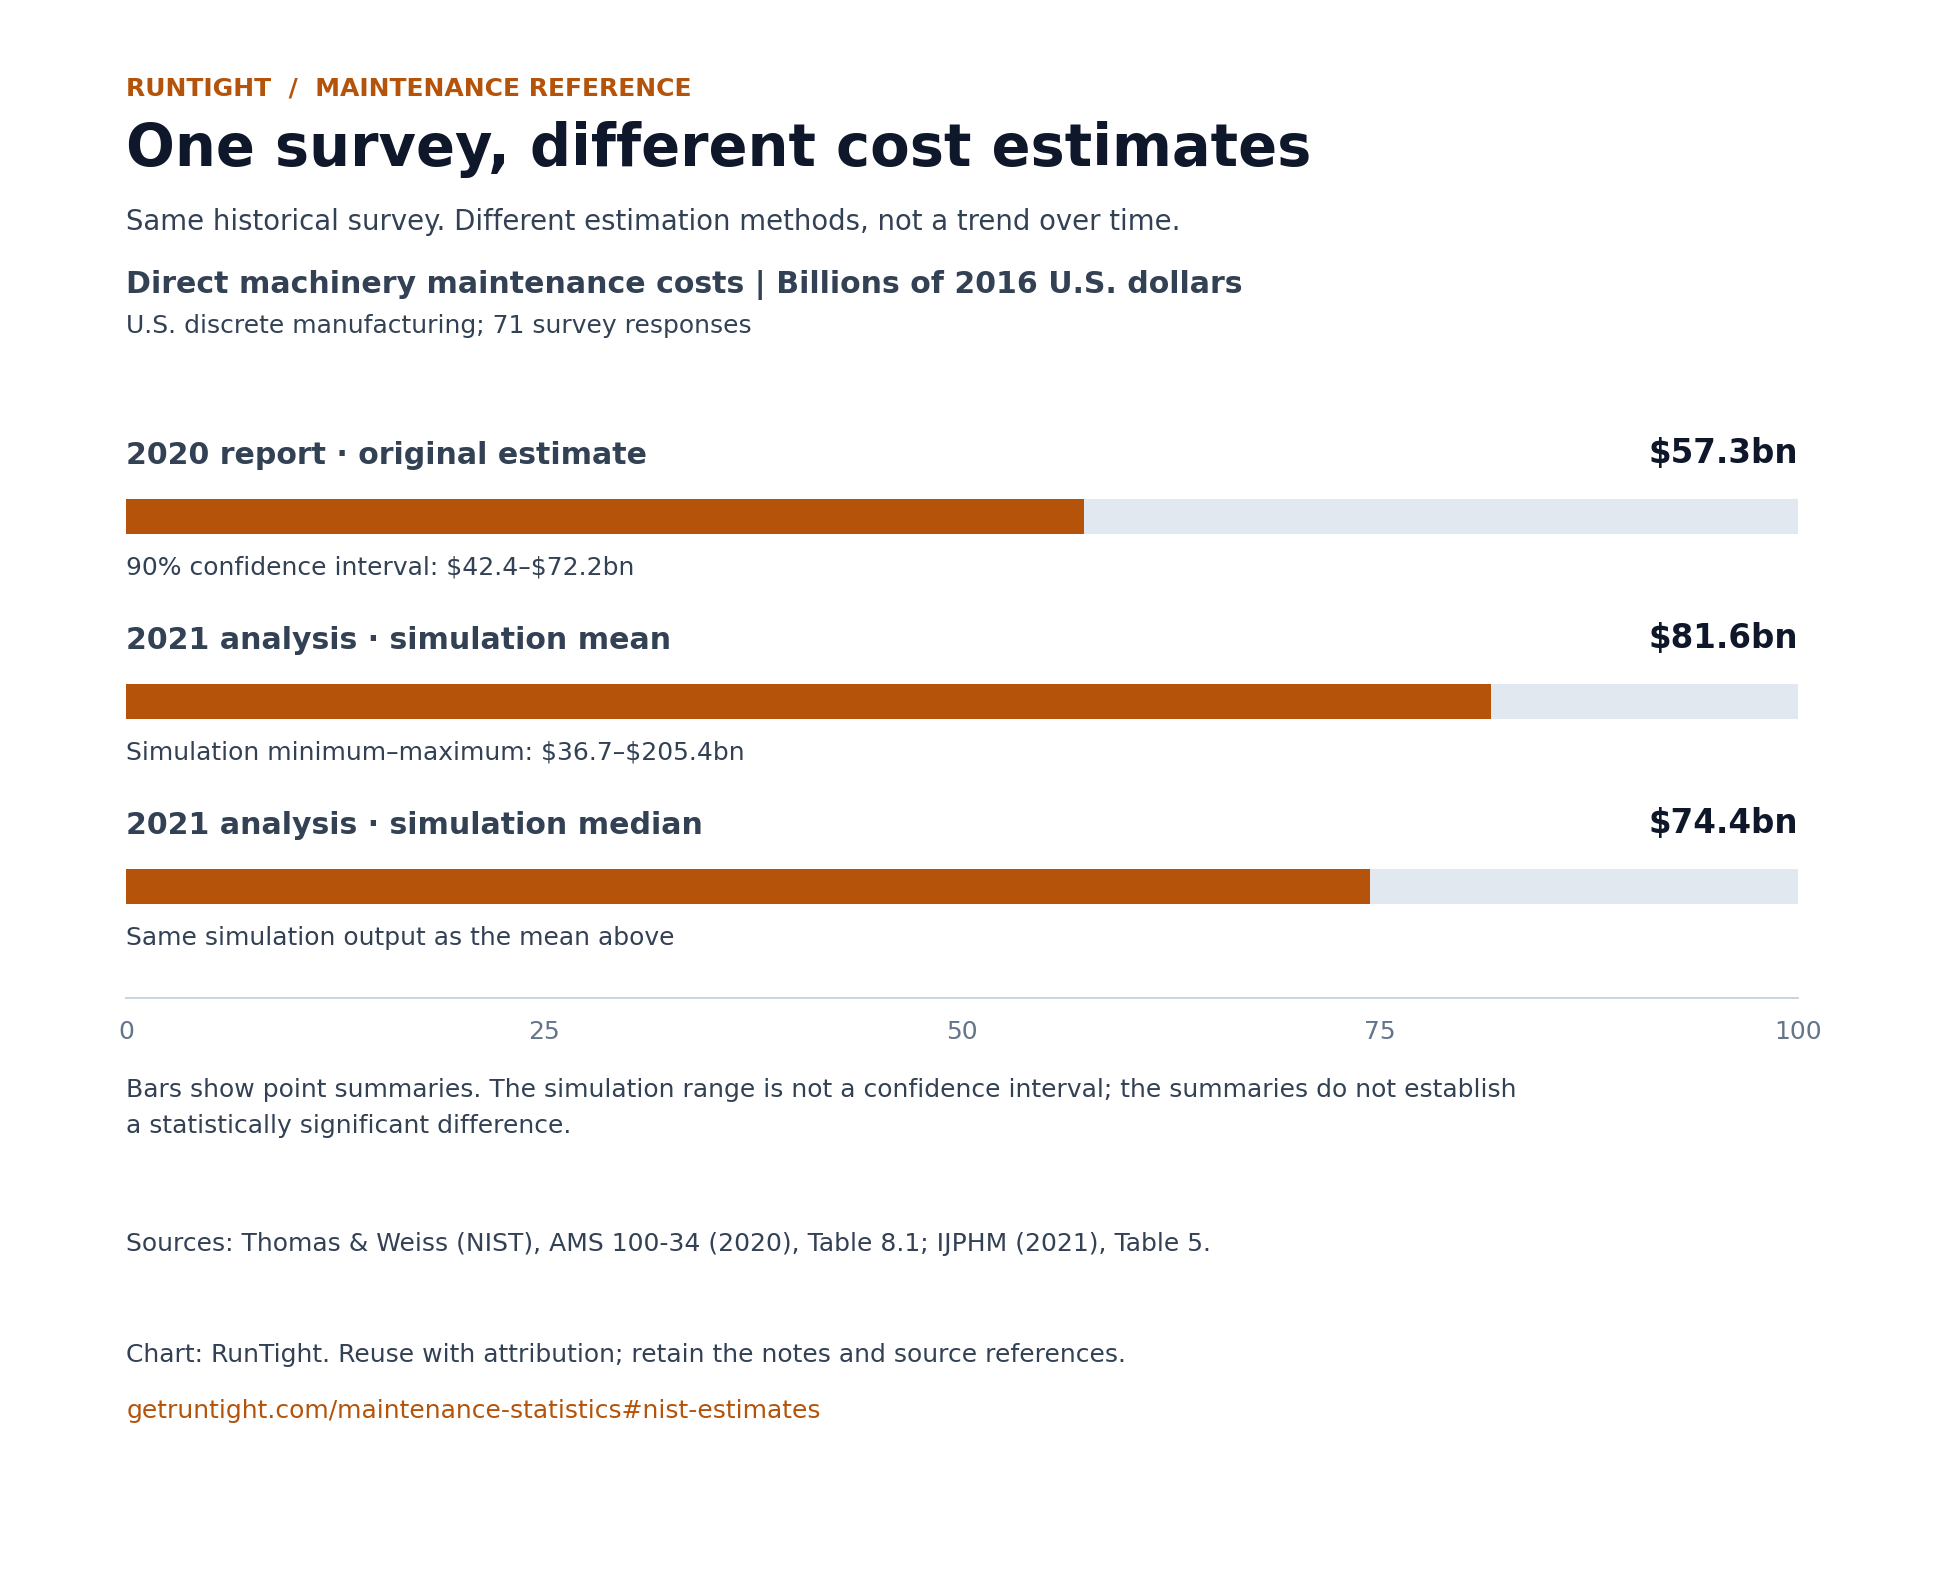
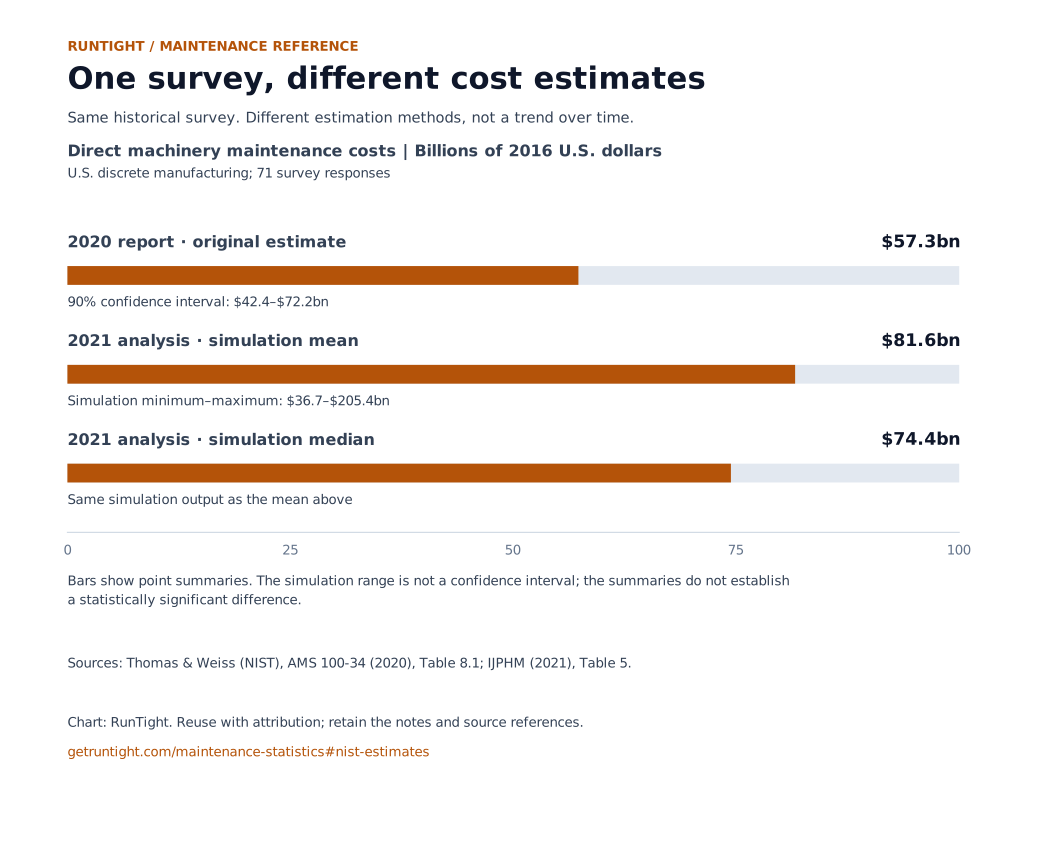
The 2020 report estimates direct maintenance spending at $57.3 billion. The authors’ 2021 paper reanalyzes the same survey, varying the scaling method and resampling responses in 10,000 simulations. It reports a mean of $81.6 billion and a median of $74.4 billion. All three are national estimates in 2016 dollars.

The publication years identify the methods. They do not show spending growth between 2020 and 2021.

One survey, different cost estimates

Direct machinery maintenance costs · Billions of 2016 U.S. dollars
U.S. discrete manufacturing; 71 survey responses

2020 report · original estimate$57.3bn

90% confidence interval: $42.4–$72.2bn

2021 analysis · simulation mean$81.6bn

Simulation minimum–maximum: $36.7–$205.4bn

2021 analysis · simulation median$74.4bn

Same simulation output as the mean above

Bars show point summaries. The simulation range is not a confidence interval; the summaries do not establish a statistically significant difference.

Sources: Thomas & Weiss, NIST AMS 100-34, Table 8.1 (2020); IJPHM, Table 5 (2021). The 2021 paper’s Table 4 reproduces the original estimate. Chart and comparison by RunTight.

You may reuse RunTight’s chart with attribution to RunTight and the original NIST research. Keep its scope, dollar year, and uncertainty notes attached.

02 / How the work gets done

Reactive maintenance & reliability

Survey findings about how maintenance is performed. Associations between practices and outcomes do not establish what a software purchase will save.

2020 publication · historical survey

45.7%

Average reactive maintenance cost share

NIST reported an average reactive-maintenance share of 45.7% of machinery maintenance and repair costs among surveyed establishments.

Scope
U.S. discrete manufacturing; NAICS 321–339, excluding 324 and 325
When citing
An average of establishments’ reported cost shares, not a share of jobs, labor hours, or manufacturers. It is not a cost-weighted national total.
NIST AMS 100-34

Table 7.1, printed p. 35; Appendix A, question 7, printed p. 44

Permanent link
Cite this statistic: Average reactive maintenance cost share

2020 publication · historical survey

3.3×

Downtime in the most reactive group

NIST associated the highest reactive-maintenance quartile with 3.3 times the downtime of the lowest quartile.

Scope
Establishments in NIST’s Machinery Maintenance Survey
When citing
Compares total downtime as a share of planned production time in the top and bottom 25% by reactive maintenance cost share. NIST calls these comparisons anecdotal; this is not a guaranteed reduction from preventive maintenance.
NIST research summary

Summary; comparator defined in AMS 100-34, executive summary and Table 7.2

Permanent link
Cite this statistic: Downtime in the most reactive group

03 / The people behind the equipment

The maintenance workforce

Employment, pay, and hiring projections for one defined U.S. occupational group. Keep the group and time period attached when citing a number.

2025

547,300

Jobs in the occupational group

BLS reports about 547,300 U.S. jobs for industrial machinery mechanics, machinery maintenance workers, and millwrights in 2025.

Scope
U.S. industrial machinery mechanics, machinery maintenance workers, and millwrights, across industries
When citing
Covers these three occupations across industries, not just manufacturing.
BLS Occupational Outlook Handbook

Work Environment

Permanent link
Cite this statistic: Jobs in the occupational group

May 2025 · USD

$64,100

Median annual wage

The U.S. median annual wage for industrial machinery mechanics, machinery maintenance workers, and millwrights was $64,100 in May 2025, according to BLS.

Scope
U.S. industrial machinery mechanics, machinery maintenance workers, and millwrights, across industries
When citing
Median wage, not average salary or total employer compensation.
BLS Occupational Outlook Handbook

Pay

Permanent link
Cite this statistic: Median annual wage

2025–2035 projection

14%

Projected employment growth

BLS projects 14% U.S. employment growth for industrial machinery mechanics, machinery maintenance workers, and millwrights from 2025 to 2035.

Scope
U.S. industrial machinery mechanics, machinery maintenance workers, and millwrights, across industries
When citing
Growth over the full decade, not an annual growth rate.
BLS Occupational Outlook Handbook

Job Outlook

Permanent link
Cite this statistic: Projected employment growth

2025–2035 annual average

51,900

Projected openings per year

BLS projects about 51,900 U.S. openings annually for industrial machinery mechanics, machinery maintenance workers, and millwrights, averaged over 2025–2035.

Scope
U.S. industrial machinery mechanics, machinery maintenance workers, and millwrights, across industries
When citing
Includes replacement openings; these are not all newly created jobs.
BLS Occupational Outlook Handbook

Job Outlook

Permanent link
Cite this statistic: Projected openings per year

How to use this reference

Selection & verification

We selected publicly accessible research from NIST and BLS and checked the figures against the linked publications. Values retain the source’s rounding, population, and time period. We have not inflation-adjusted the historical estimates or combined them with newer workforce data.

Attribution & links

Credit the original research organization for its findings. If this reference helped your reporting, link to this page or an individual statistic’s permanent link and credit RunTight for the compilation. Each citation includes both links and the qualification needed to interpret the number.

Limits of the evidence

National estimates are not a budget for an individual plant. Survey associations do not prove that a maintenance strategy causes a particular result. Employment projections do not measure today’s vacancies. These sources do not measure RunTight’s product performance.

Updates & corrections

Last source check: September 29, 2026. This page is reviewed manually; its date changes when the content or source review changes. Found a revised figure or a broken source? Send a correction with the source link.

Source register

Four publications from two research organizations. The NIST summary and 2021 analysis use the same historical survey as AMS 100-34.

  1. 01
    Economics of Manufacturing Machinery Maintenance: A Survey and Analysis of U.S. Costs and Benefits

    National Institute of Standards and Technology · June 2020

    Historical estimates in 2016 dollars. Table 3.2 lists 71 survey responses; estimates have wide uncertainty intervals. NIST describes the maintenance-strategy comparisons as anecdotal, not causal evidence.

  2. 02
    Research Suggests Significant Benefits to Investing in Advanced Machinery Maintenance

    National Institute of Standards and Technology · June 15, 2020

    A summary of AMS 100-34, not a second independent study. A later website update does not change the underlying observation period.

  3. 03
    Maintenance Costs and Advanced Maintenance Techniques in Manufacturing Machinery: Survey and Analysis

    National Institute of Standards and Technology · April 2021

    Extends the 2020 report with Monte Carlo analysis and resampling across scaling methods. Dollar estimates remain in 2016 USD. This is a methodological extension, not a new annual observation.

  4. 04
    Industrial Machinery Mechanics, Machinery Maintenance Workers, and Millwrights

    U.S. Bureau of Labor Statistics · August 27, 2026 update

    This occupational group does not include every maintenance job. Employment and wages refer to 2025; projections cover 2025–2035. Projections are estimates, not observed outcomes.

Find our maintenance statistics on Google

Choose RunTight as a preferred source.

Add RunTight as a preferred source on Google (opens in a new tab)